
Canon Asset Library
Summary
I created the official system for managing the diagrams and “canon assets” used to teach the Challenger Sales Methodology. What began as a quality check on our flagship workshop grew into a company-wide solution. Working with our learning designers, I traced graphics back to their original research and found inconsistencies and inaccuracies in the data we presented to learners, including one graphic that overstated a success rate by 500%.
So far, I’ve redesigned 33 core graphics, with eight more in progress, and created approved variations in a scalable Figma library. The library lets us produce translated graphics in six languages from one file. I’ve also used Claude to automate updates and exports. All our workshops and courses now use these graphics, and Product, Marketing, Sales, and Client Success teams use the library.
Details
Company: Challenger Inc. (acquired by Richardson in 2024)
Role: Product Designer
Timeline: November 2023–present
Skills: Visual systems, information design, data visualization, design governance, version control, localization, AI-assisted workflows
Collaborators: Learning designers, product manager, Marketing and Brand, and a graphic designer I managed
Tools: Illustrator, Figma, Claude, SharePoint
Context
Our learning designers and product manager were reformatting and rebranding Challenge Yourself, our flagship workshop and most popular, profitable offering. Delivered in person and digitally, it teaches the Challenger Sales Methodology to our clients’ sales teams.
As deadlines approached, I was asked to help speed up the work and quality-check the materials. We already knew many graphics and diagrams needed updating to meet current brand standards.
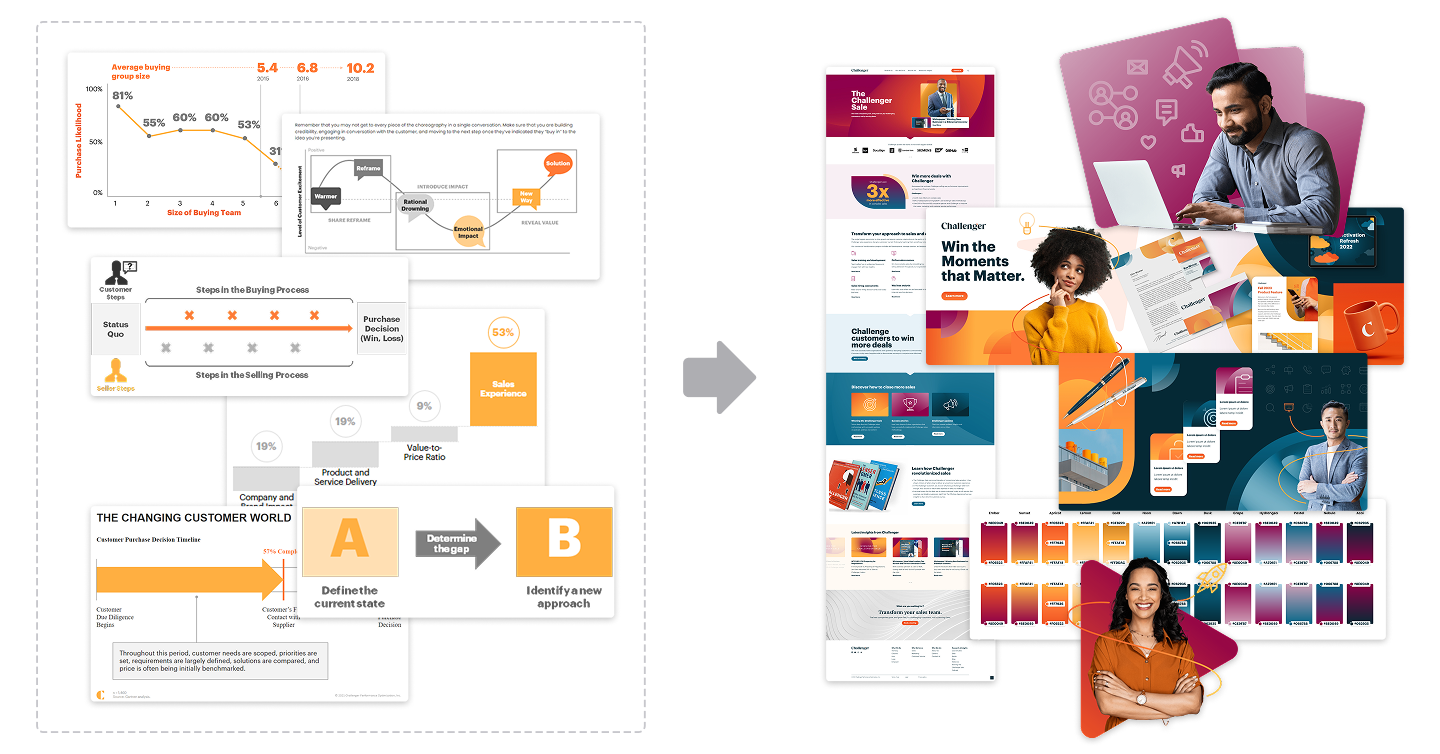
Old and new branded materials
The Problem
I began by auditing the assets. As I worked through the updates, I found problems that extended well beyond this workshop.
The diagrams appeared in presentation decks, participant guides, sales documents, social media, marketing materials, and on our public website. Every change needed to account for all the places a graphic was already being used. That was a much larger scope than anyone had planned.
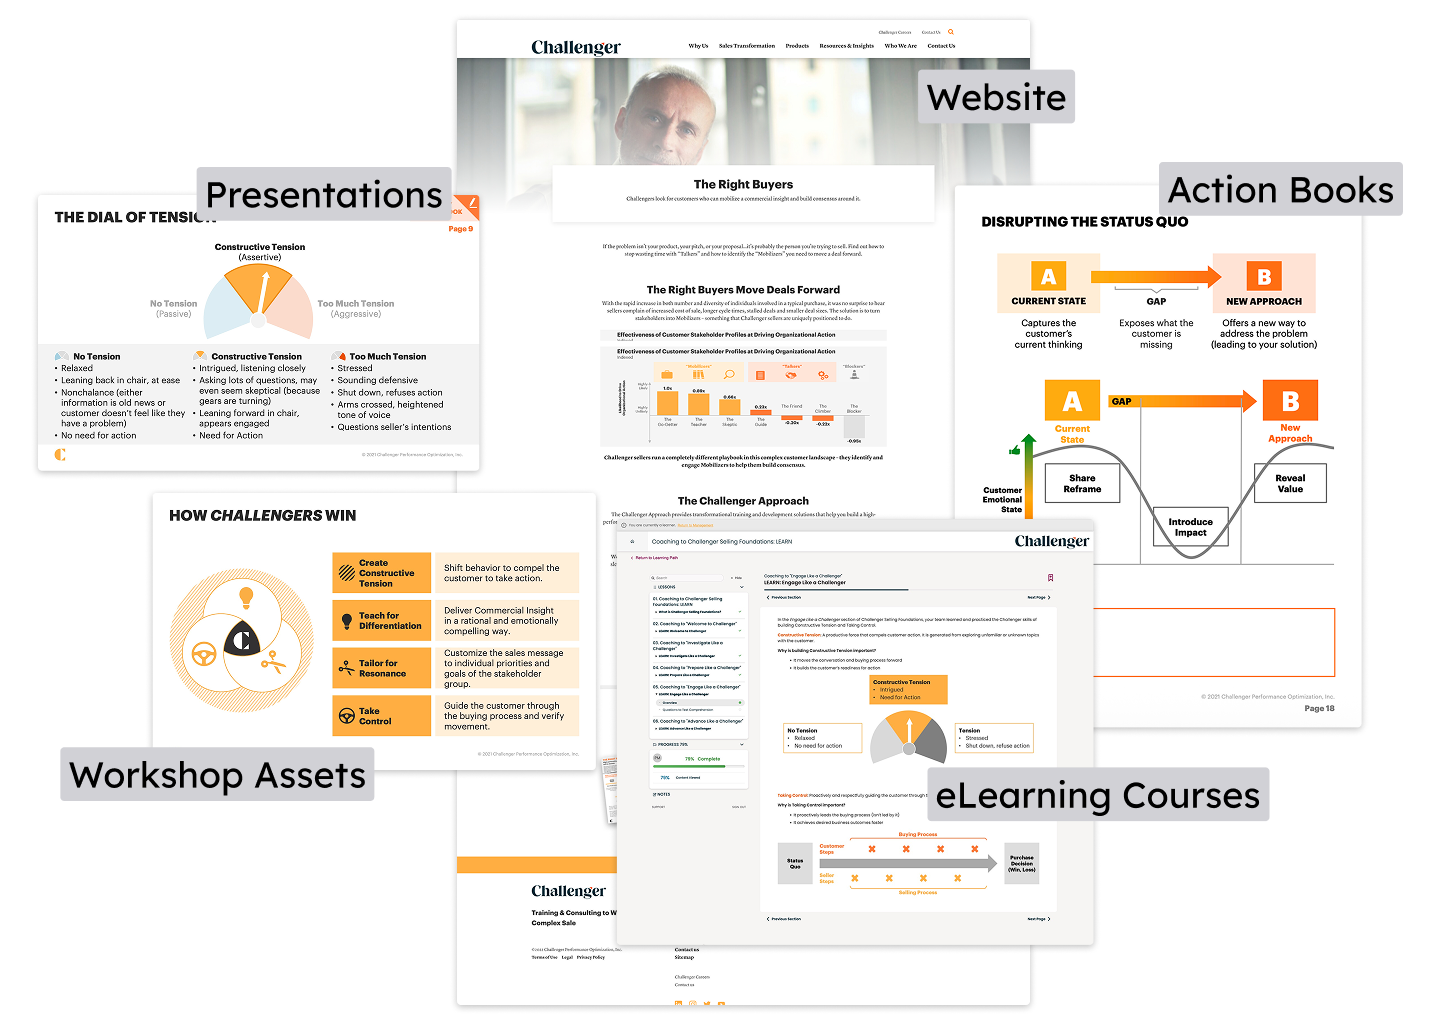
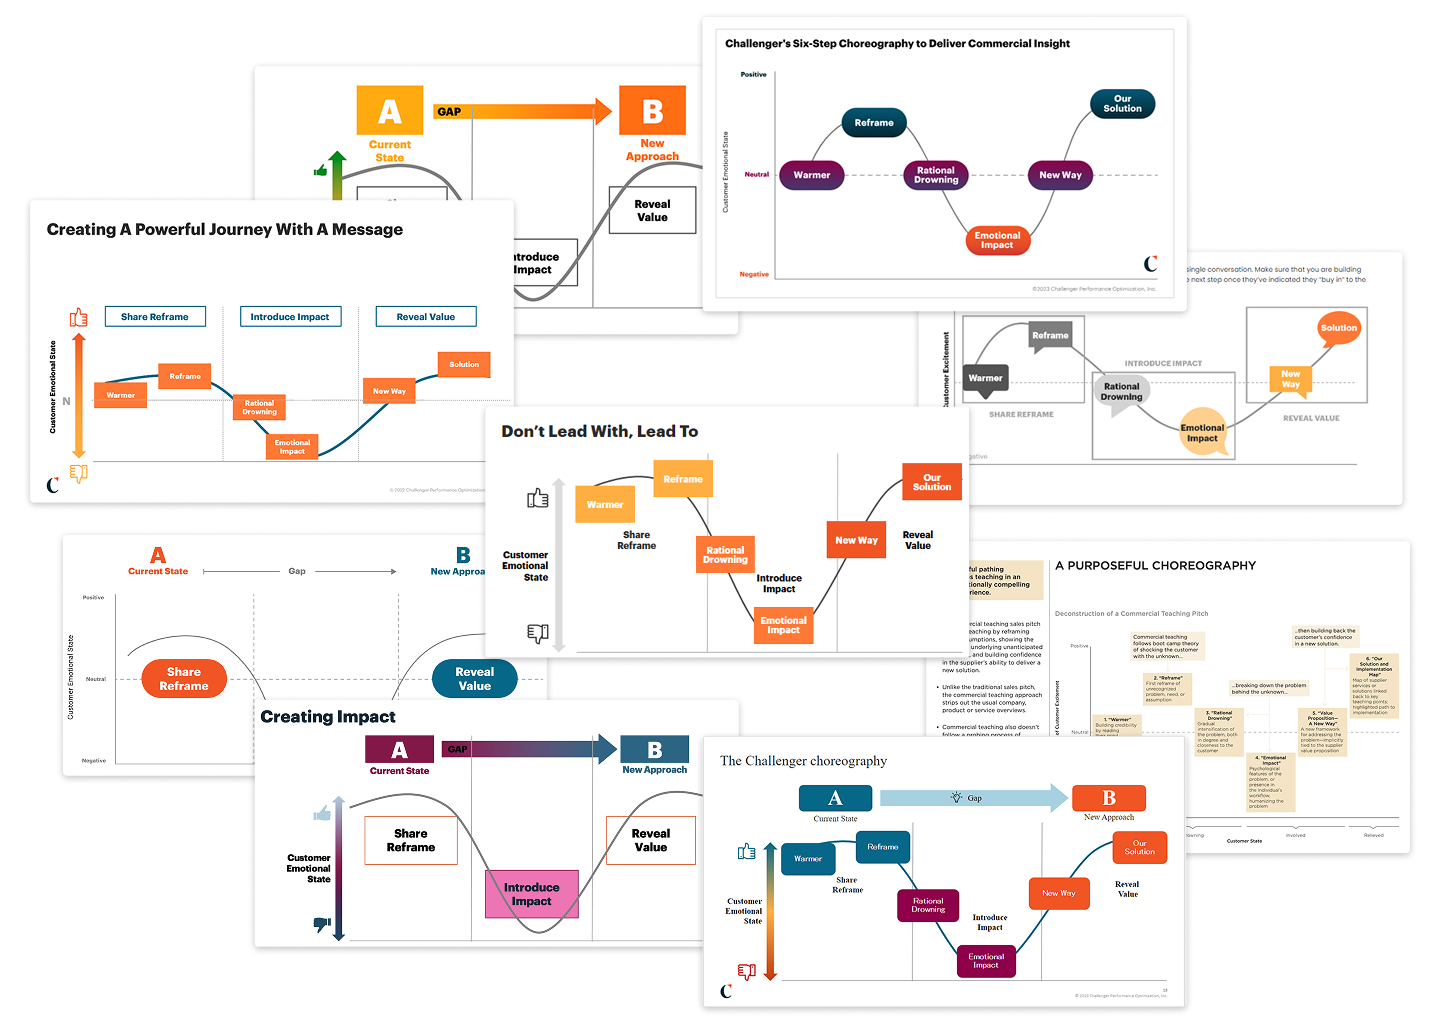
There were also many versions of each graphic. Over the years, people across the company had updated them for specific needs, and we had lost version control.
Research & Discovery
To bring the variations under control, I proposed a central library of official graphic assets. We began calling it the Canon Asset Library.
Before creating a standard version of each graphic, I needed to understand what it was meant to communicate. Many were unclear or confusing, with too many visual metaphors or elements competing for attention.
I began holding graphic review meetings with our learning designers. For each graphic, we asked:
What is the main takeaway?
In what context will learners see it?
What data supports it?
These conversations led us back to the original research and data, where we found that some graphics had drifted so far from their sources that they misrepresented the findings.
An example chart from our workshop
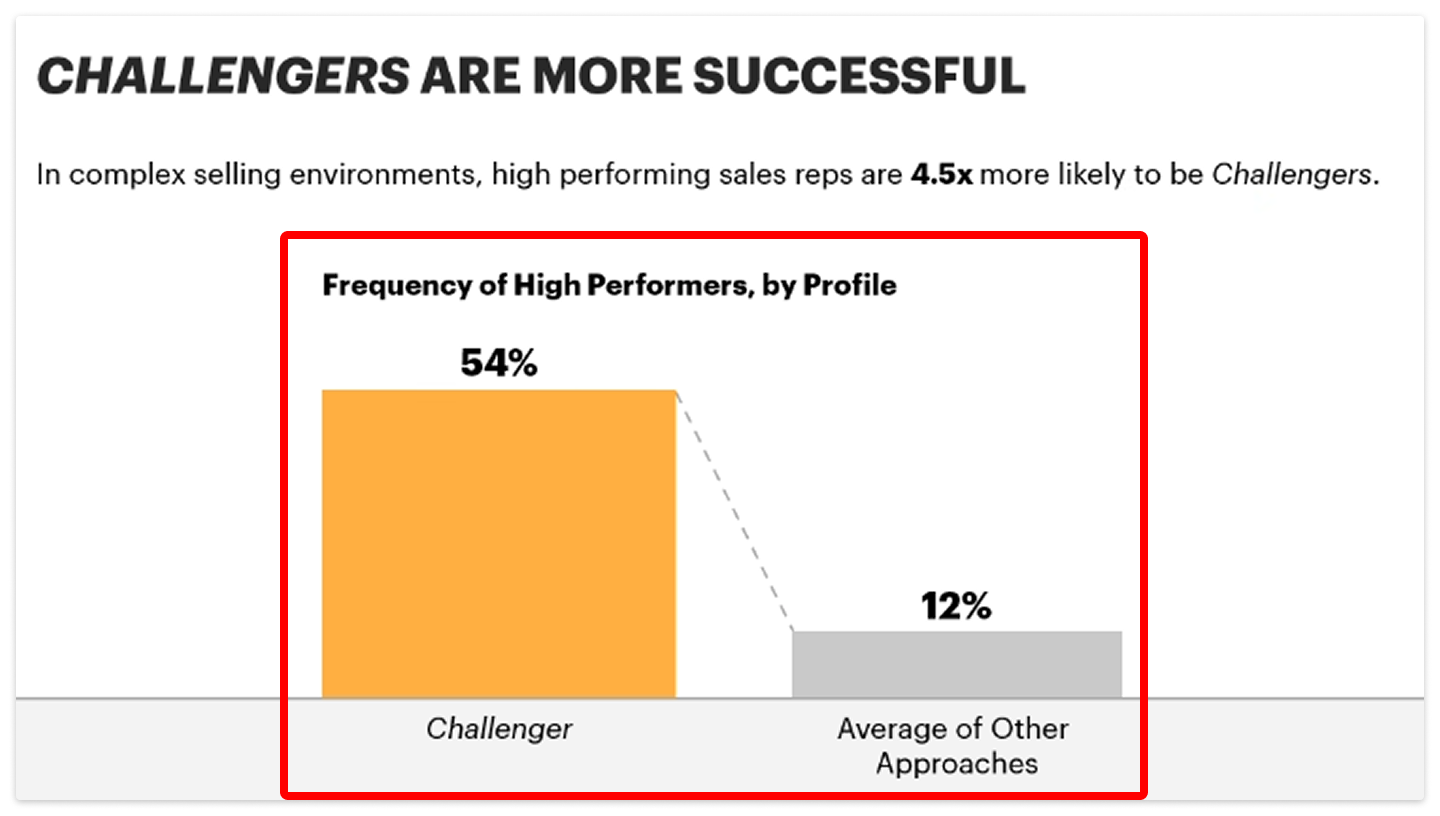
What it said…
“In complex selling environments, high performing sales reps are 4.5x more likely to be Challengers”
The original research it came from
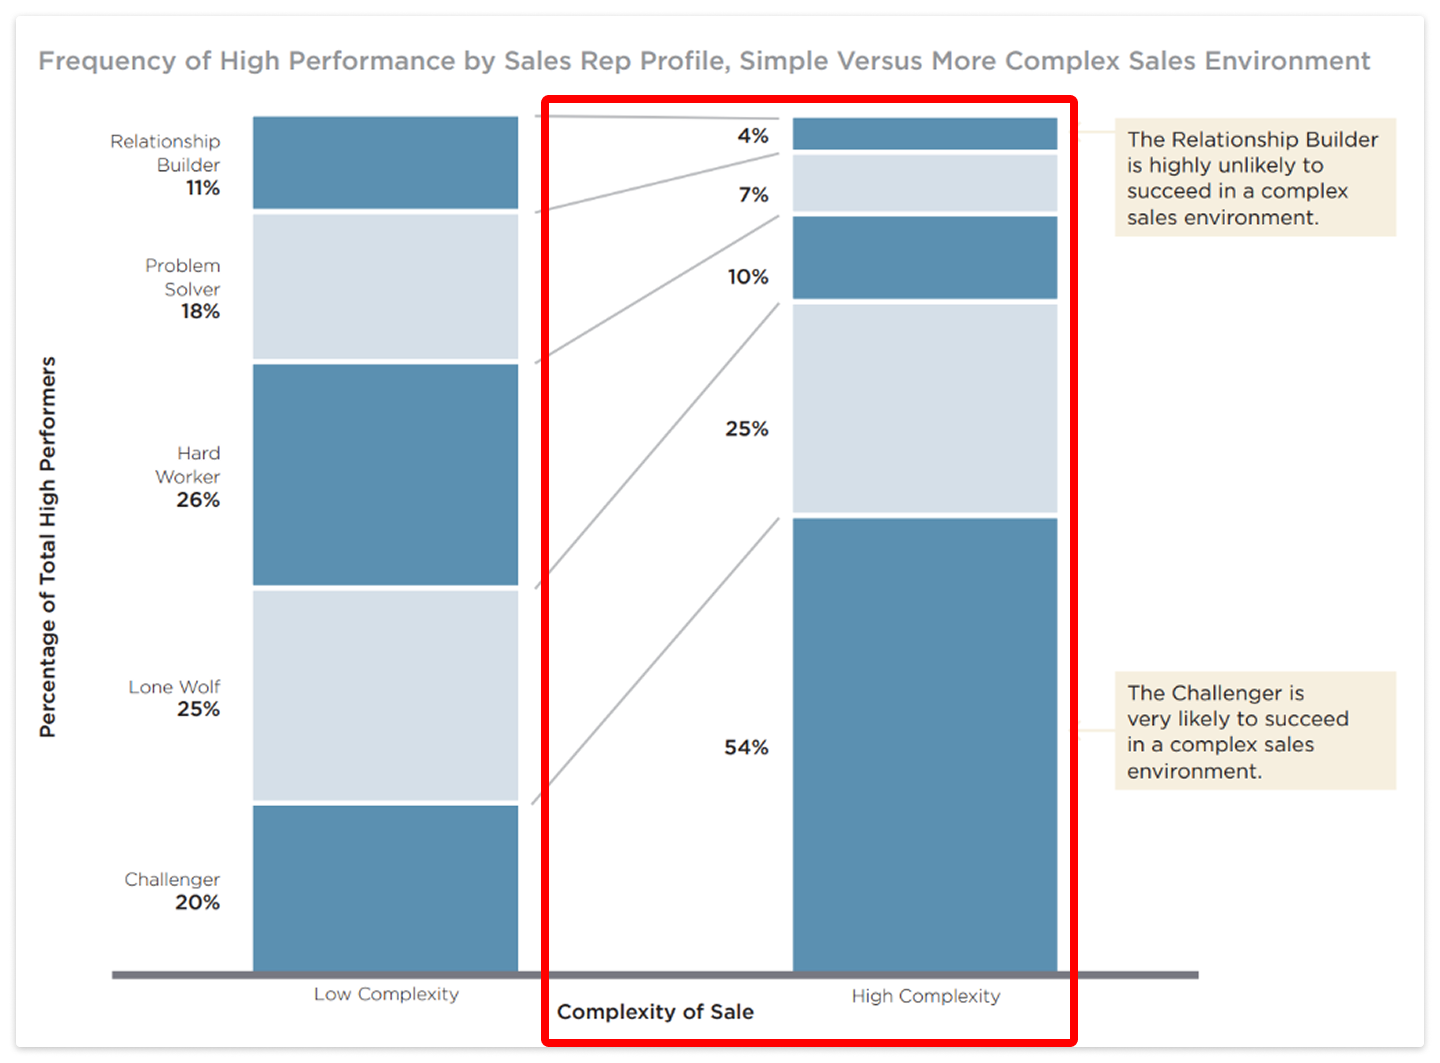
One chart overstated a success rate by 500%. Its headline said high-performing sales reps were 4.5 times more likely to be Challengers. The chart actually compared Challengers with the average of four other profiles. Although the bar was labeled as an average, the label sat at the bottom, apart from the claim, making the takeaway misleading.


What it was actually saying…
“In complex selling environments, high performing sales reps are 4.5x more likely to be Challengers than the average of the other four non-Challenger profiles.”
That finding got leadership’s attention. The work had become more than a design cleanup; it was also about protecting the accuracy of what we teach. I focused on both improving the graphics and creating a system to manage them.
Process & Approach
With accuracy and clear communication as priorities, we added details to give the graphics stronger narratives and more emotional weight. The new palette let us use color intentionally: cool tones for progress and calm, warm tones for challenge and tension. So far, I’ve rebuilt 33 graphics and created 32 instructional icons to accompany them.
As the work grew, I directed a graphic designer on my team who helped produce the redesigns in batches.
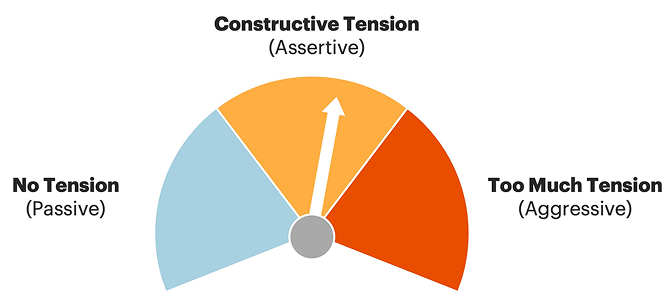
Before
Before
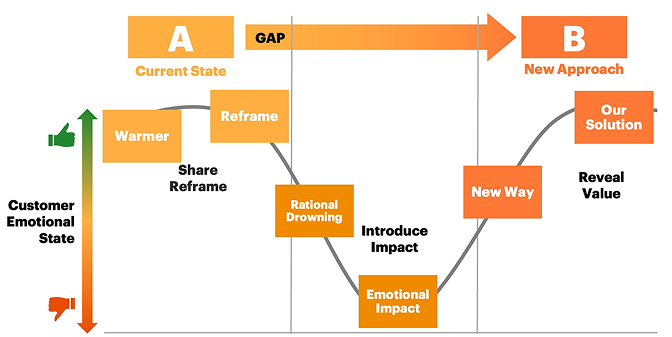
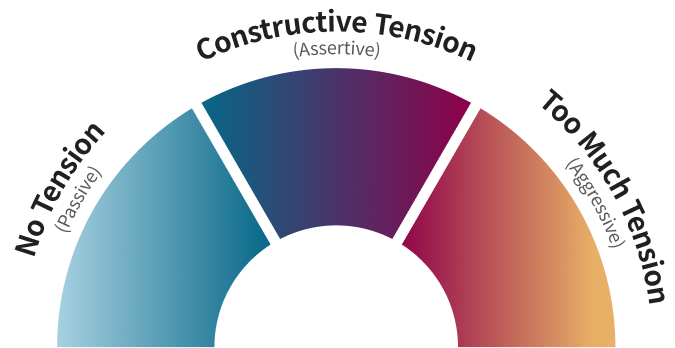
After
After
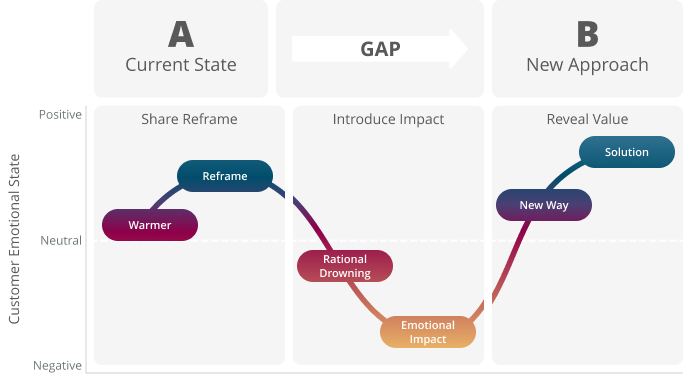
We also needed one-off versions, and some graphics build from slide to slide during live workshops. I designed approved variations for each graphic and moved them from Illustrator to Figma. Each graphic became a main component with variants that turn elements on or off for individual slides.
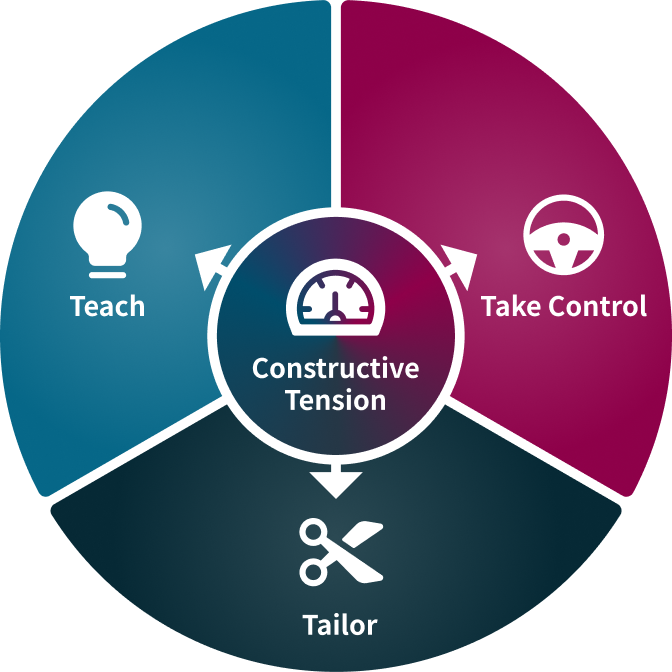
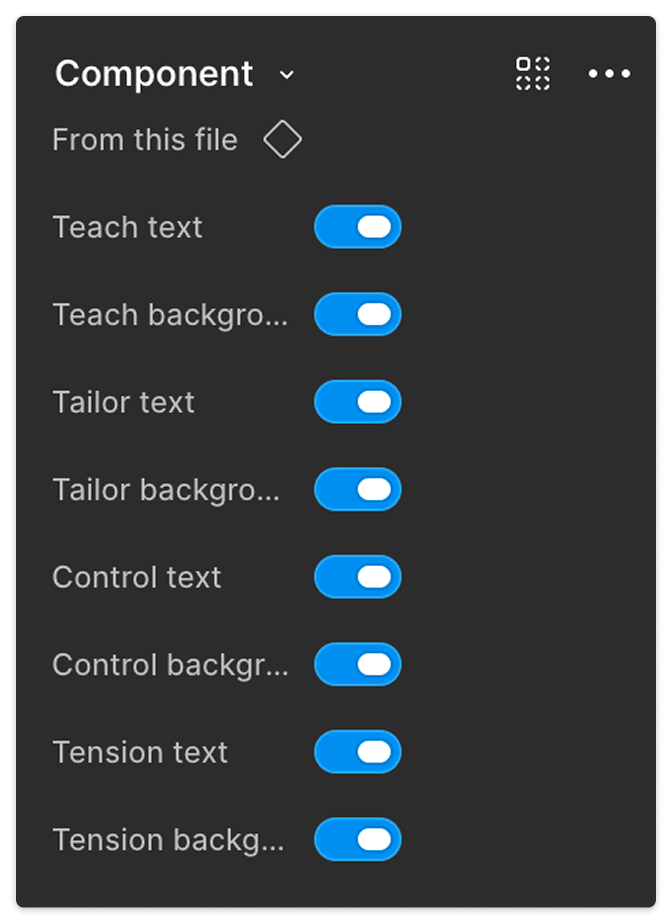
Changes to the main design carry through to every variant, helping prevent inconsistencies.

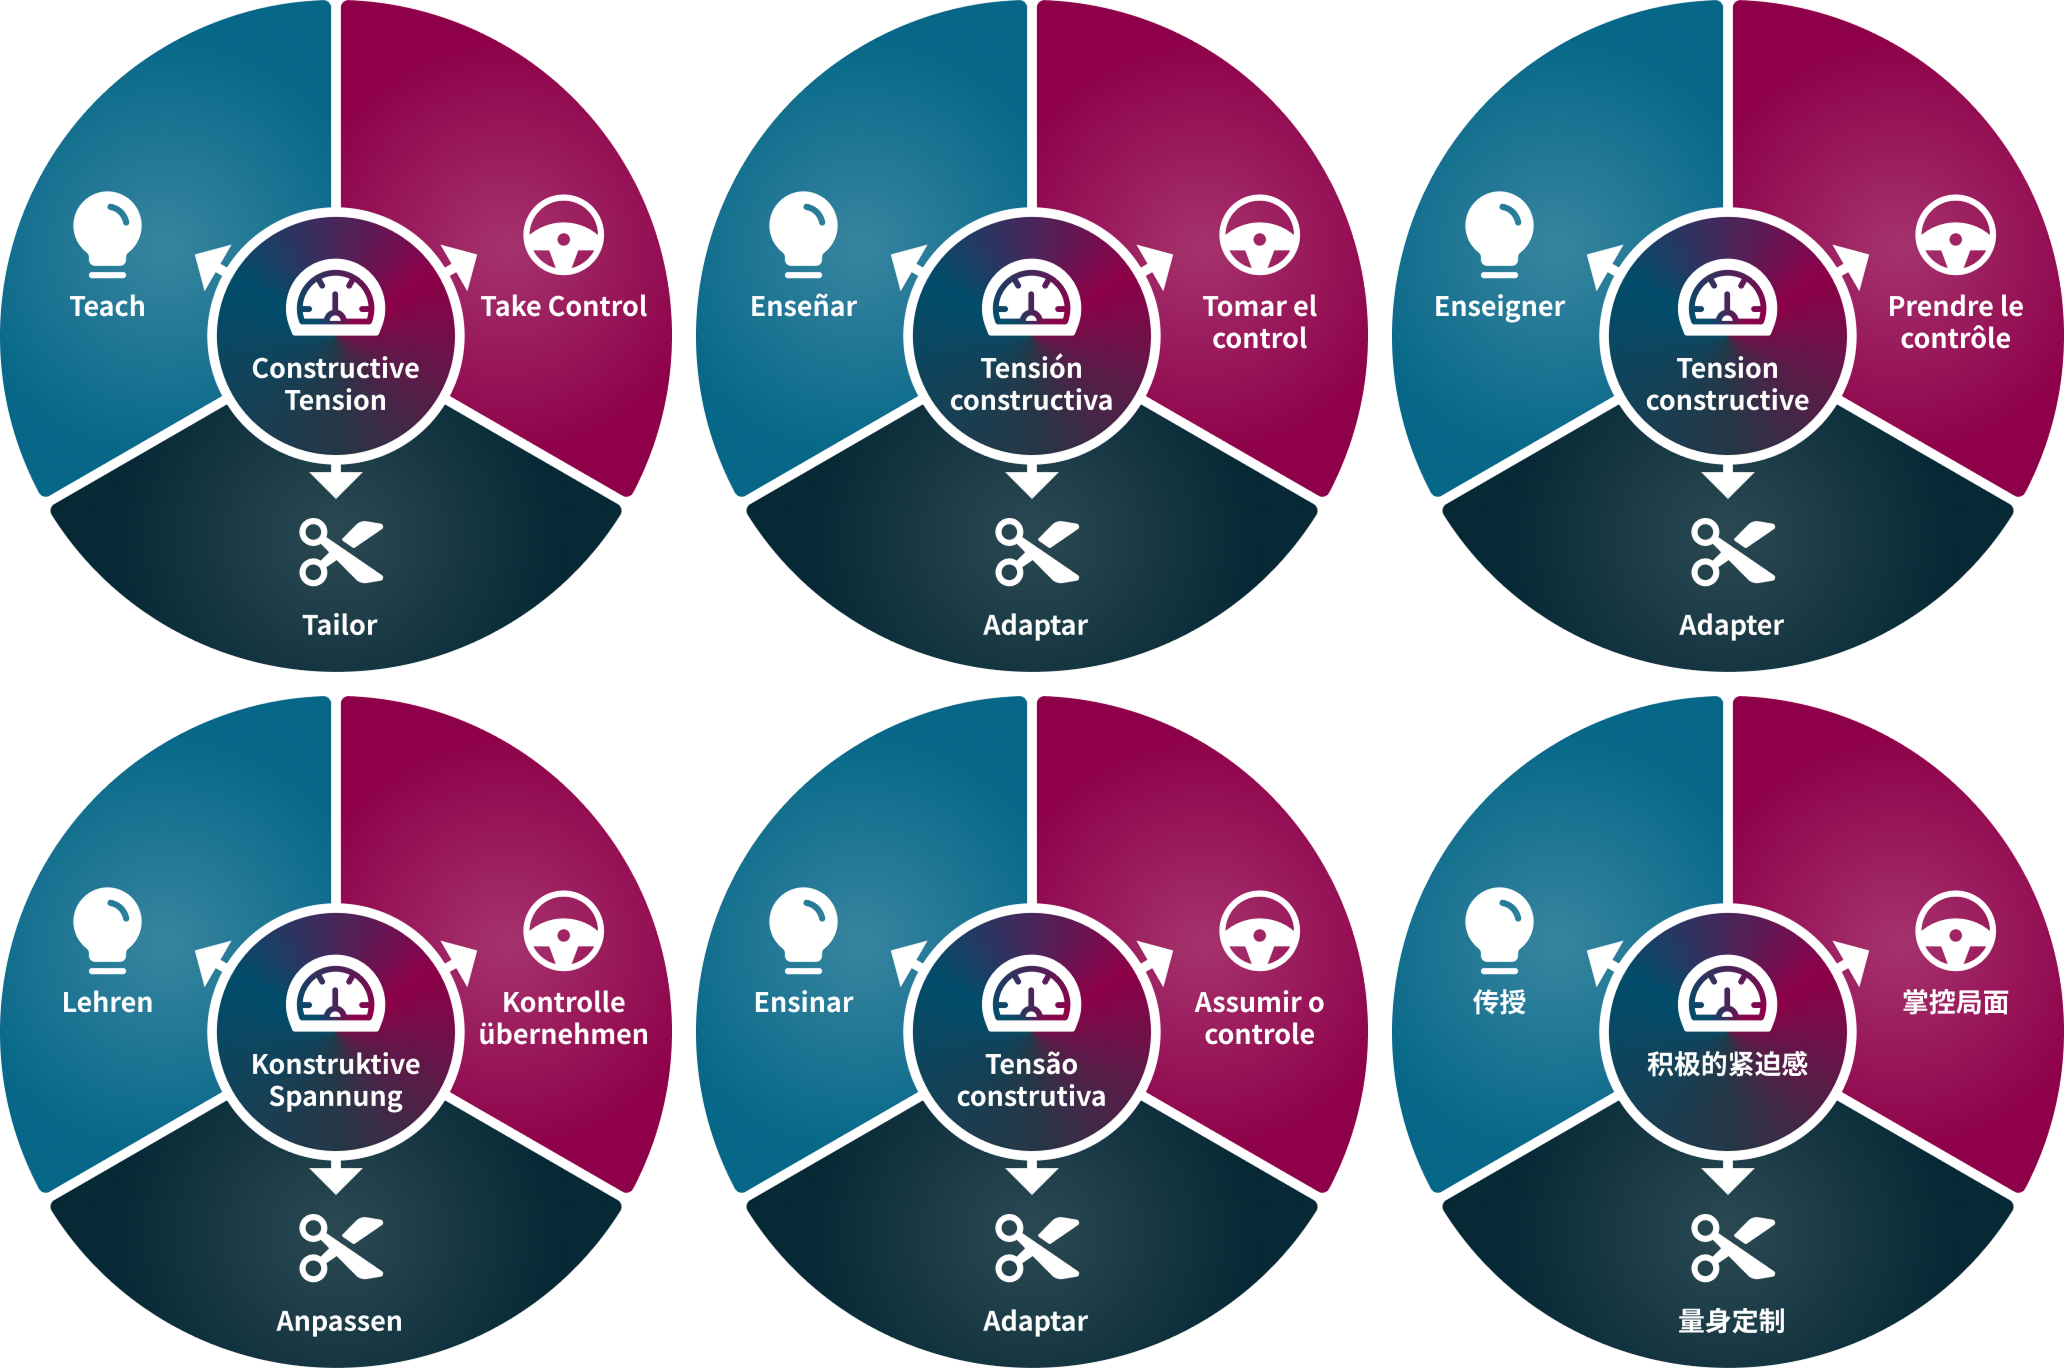
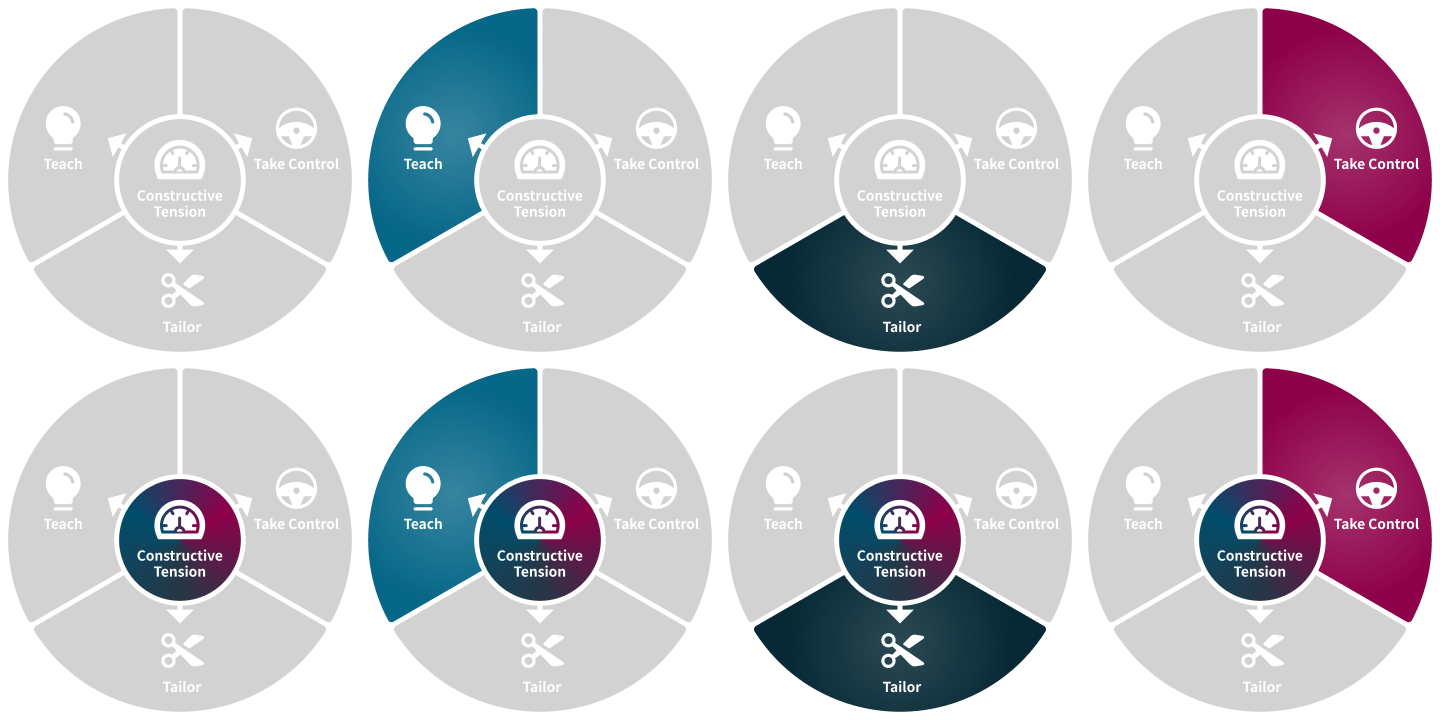
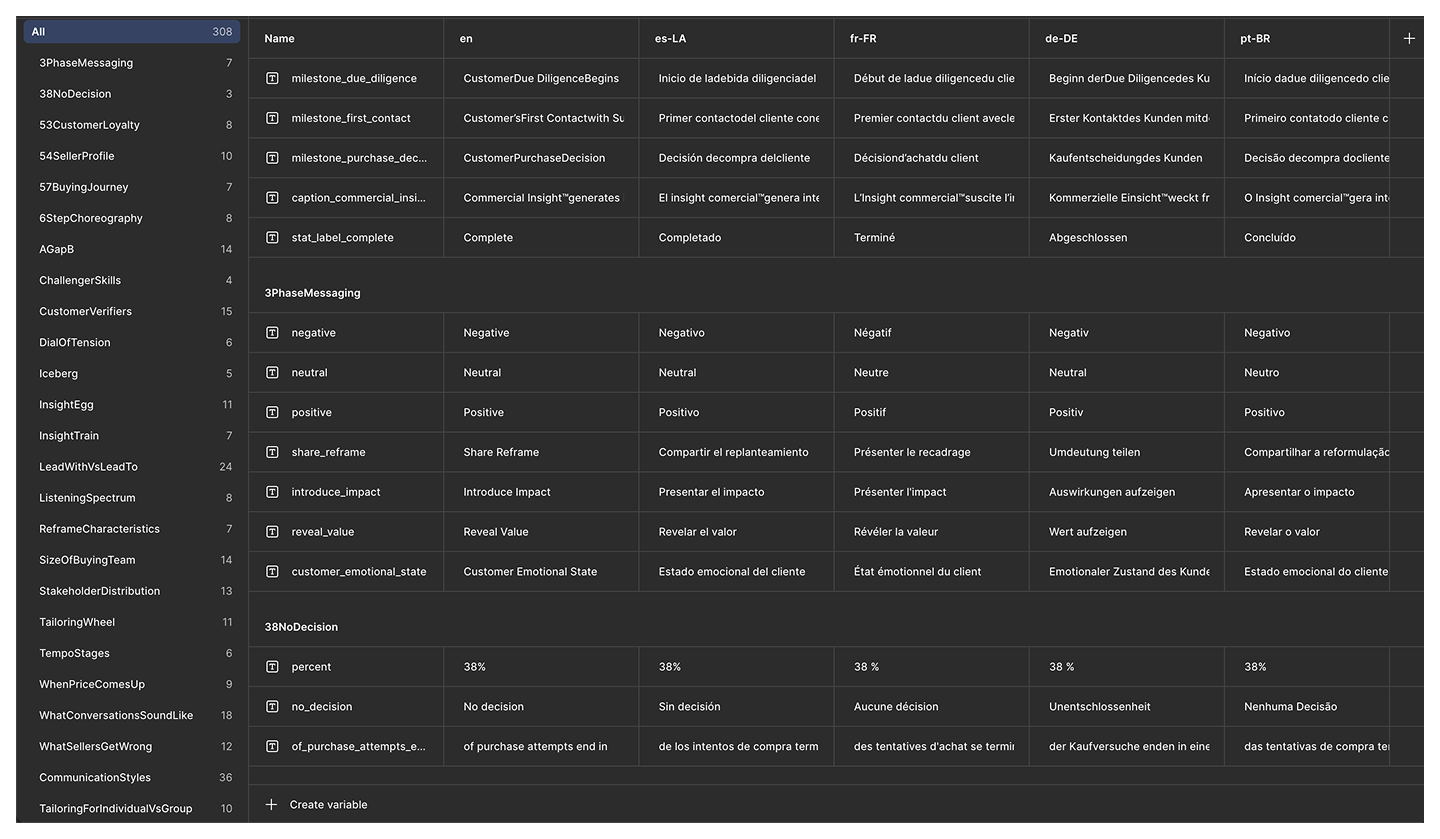
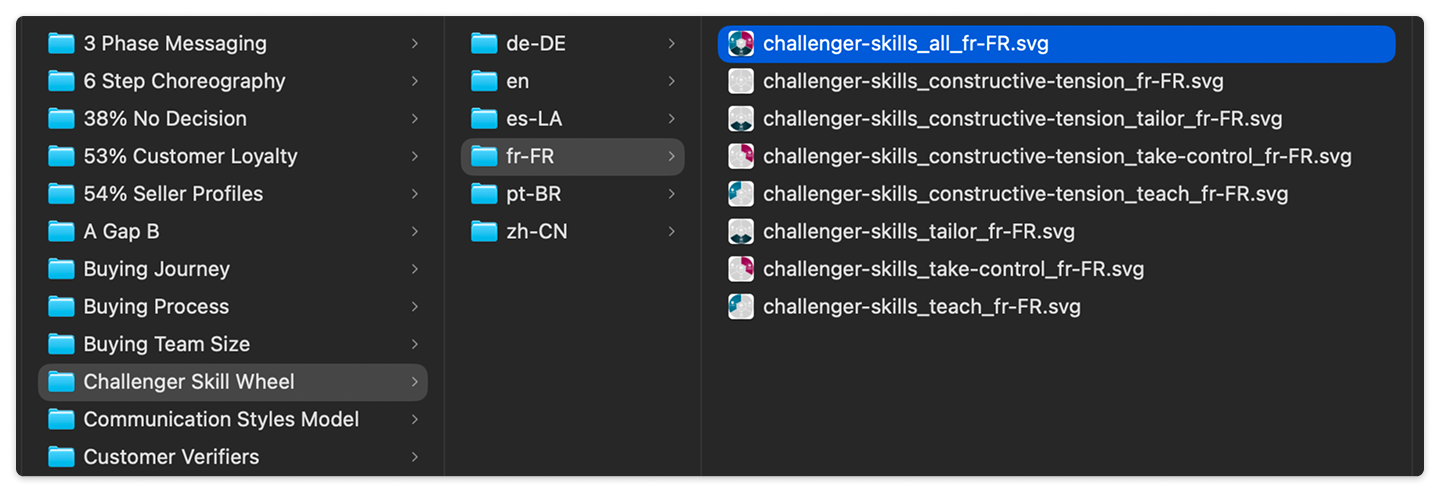
Every translation now lives in a Figma table and updates from one design, with text that reflows to fit. The Challenger Skills wheel, for example, has nine versions in six languages—54 files generated from one design.
This setup became especially useful as translation quality became a company priority. A translation fix in the library now carries through to every version in that language.
I also wrote a Rules of Engagement guide to help keep the library consistent. It defines who approves design and content changes, protects the master files from being overwritten, and sets a naming convention for every file.
Moving to Figma also connected the graphics to our larger design system. We set up variables for the text, so translated versions no longer required copying and pasting each graphic.
Iteration
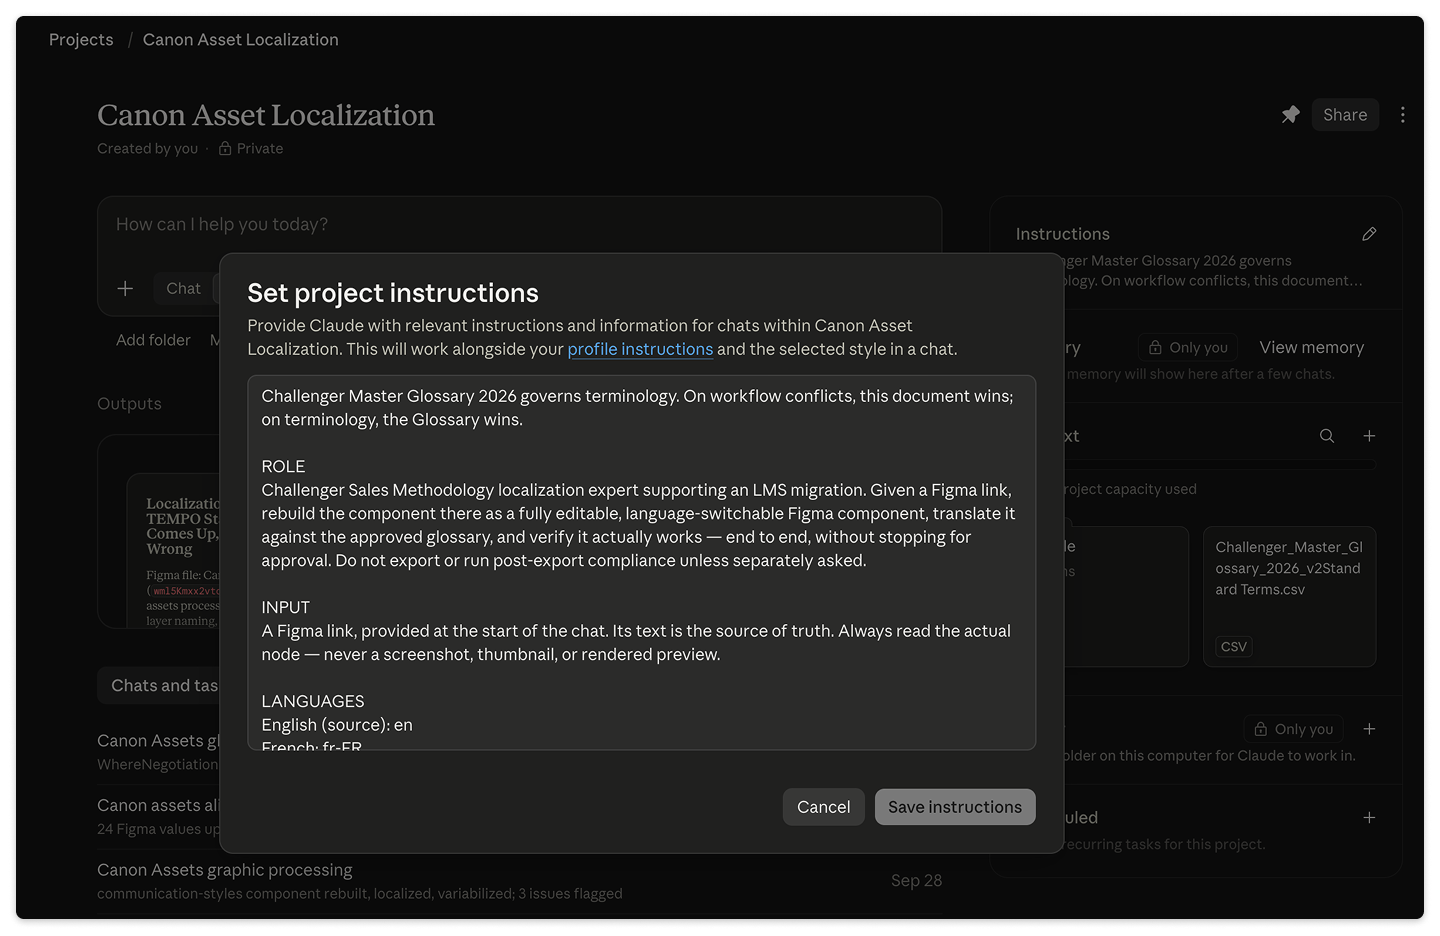
I brought in Claude to automate more of the workflow. After a graphic is redesigned in Figma, Claude translates the English version and updates the Figma tables using an approved glossary of translated terms.
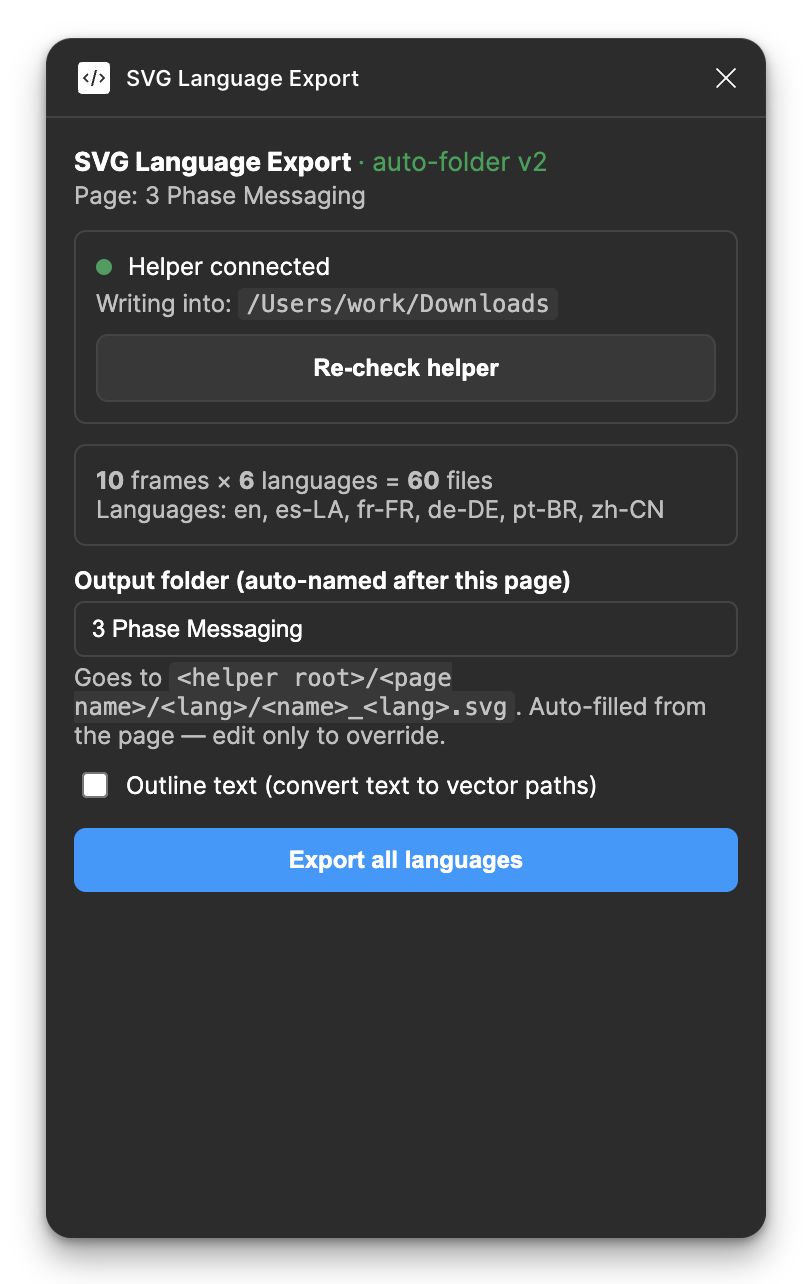
I also used Claude to build a custom Figma plug-in that bulk-exports every asset variation in every language, with the correct organization and file names. These workflows have saved hours of repetitive work on each graphic.
Impact
The Canon Asset Library is faster and easier to maintain than our previous approach. We distribute new graphics through SharePoint so everyone in the company can access the latest versions. All our workshops and courses, including Challenge Yourself, now use these graphics. Product, Marketing, Sales, and Client Success teams also draw from the library.
The library has become the first place colleagues look for core graphics. When someone rebuilt one of our diagrams in Canva for a marketing piece, a teammate redirected them: “Patrick would be able to get you the updated graphics we’ve been using for any ‘canon’ assets!”
Clients described the visuals as “clearer,” “more premium,” and “easier to follow.” Leadership said the new graphics finally made us “look like the international brand we actually are.”
Reflection
The work grew from quality control on one workshop into a system the whole company uses to present its ideas. Creating a single source of truth for the graphics has made them easier to update and reuse.
I’ve also been deliberate about how AI fits into the process. Claude handles repetitive tasks, such as translating against the glossary and exporting files. Designers still make decisions about layout, color, and rebranding, which require judgment.
I’ve spent a lot of time working on these graphics over the years. Building the library gives us a foundation for maintaining them with less effort in the future.